Interactive Visual Optimization and Analysis for RFID Benchmarking
Yingcai Wu1
Ka-Kei Chung2
Huamin Qu2
Xiaoru Yuan3
S.C. Cheung2
1Microsoft Research Asia
2Hong Kong University of Science and Technology
3Peking University
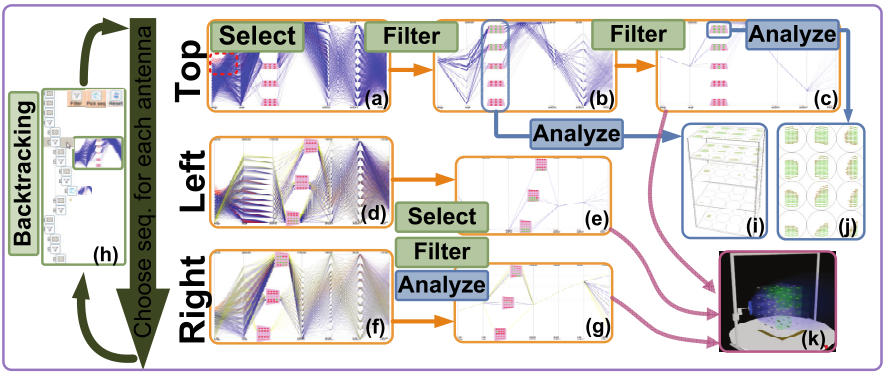
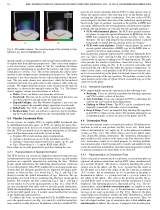
Radio frequency identification (RFID) is a powerful automatic remote identification technique that has wide applications. To facilitate RFID deployment, an RFID benchmarking instrument called alpha Gate has been invented to identify the strengths and weaknesses of different RFID technologies in various environments. However, the data acquired by alpha Gate are usually complex time-varying multidimensional 3D volumetric data, which are extremely challenging for engineers to analyze. In this paper, we introduce a set of visualization techniques, namely, parallel coordinate plots, orientation plots, a visual history mechanism, and a 3D spatial viewer, to help RFID engineers analyze benchmark data visually and intuitively. With the techniques, we further introduce two workflow procedures (a visual optimization procedure for finding the optimum reader antenna configuration and a visual analysis procedure for comparing the performance and identifying the flaws of RFID devices) for the RFID benchmarking, with focus on the performance analysis of the α Gate system. The usefulness and usability of the system are demonstrated in the user evaluation.
@article {YWu2009,
author = {Yingcai Wu and Ka-Kei Chung and Huamin Qu and Xiaoru Yuan and S.C. Cheung},
title = {Interactive visual optimization and analysis for RFID benchmarking} ,
journal = {IEEE Transactions on Visualization and Computer Graphics},
year = {2009},
volume = {15},
number = {6},
pages = {1335--1342}
}
We thank Wing-Yi Chan, Wai-Kei Tsang, Ping-Luen Ng, and Lap-Hin Leung for developing the initial 3D spatial viewer and help with the user evaluation.