iTTVis: Interactive Visualization of Table Tennis Data
Yingcai Wu1
Ji Lan*1
Xinhuan Shu*1
Chenyang Ji*1
Kejian Zhao*1
Jiachen Wang*1
Hui Zhang2
Authors associated with * were the students supervised by Yingcai Wu when this work was done.
1State Key Lab of CAD & CG, Zhejiang University
2Department of Physical Education, College of Education, Zhejiang University
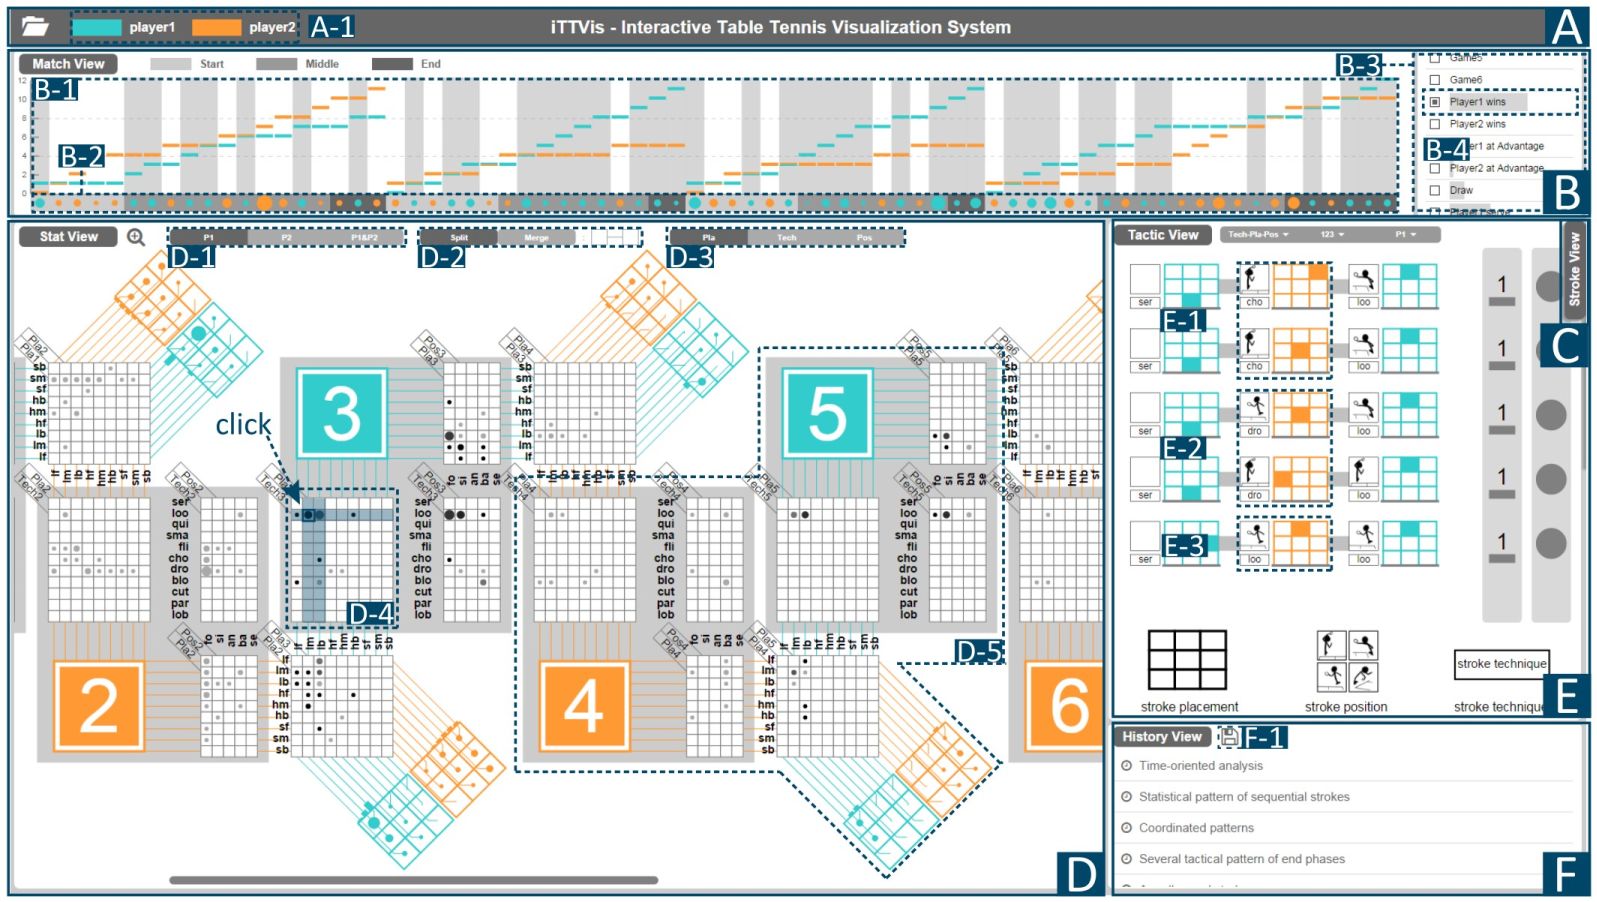
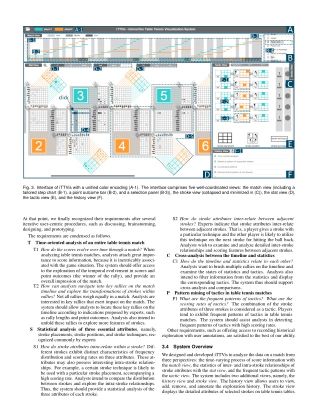
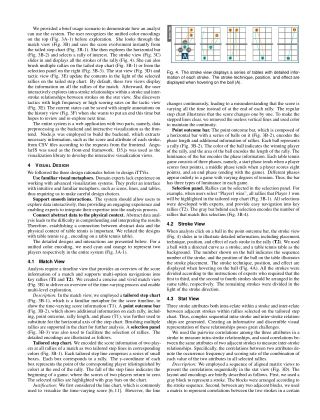
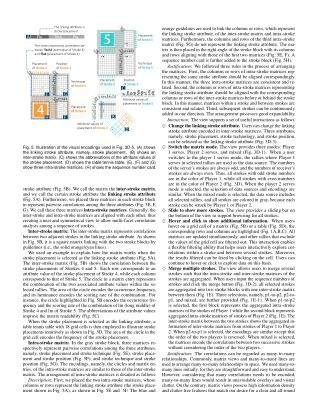
The rapid development of information technology paved the way for the recording of fine-grained data, such as stroke techniques and stroke placements, during a table tennis match. This data recording creates opportunities to analyze and evaluate matches from new perspectives. Nevertheless, the increasingly complex data poses a significant challenge to make sense of and gain insights into. Analysts usually employ tedious and cumbersome methods which are limited to watching videos and reading statistical tables. However, existing sports visualization methods cannot be applied to visualizing table tennis competitions due to different competition rules and particular data attributes. In this work, we collaborate with data analysts to understand and characterize the sophisticated domain problem of analysis of table tennis data. We propose iTTVis, a novel interactive table tennis visualization system, which to our knowledge, is the first visual analysis system for analyzing and exploring table tennis data. iTTVis provides a holistic visualization of an entire match from three main perspectives, namely, time-oriented, statistical, and tactical analyses. The proposed system with several well-coordinated views not only supports correlation identification through statistics and pattern detection of tactics with a score timeline but also allows cross analysis to gain insights. Data analysts have obtained several new insights by using iTTVis. The effectiveness and usability of the proposed system are demonstrated with four case studies.
Download [paper] [video(53MB)]
Download the full video (53MB)
The authors would like to thank Hui Chen from the College of Computer Sciene and Technology, Zhejiang University, and Zheng Zhou from the Department of Physical Education, College of Education, Zhejiang University for providing valuable feedback and suggestions for this project. The work was supported by National 973 Program of China (2015CB352503), NSFC (U1609217, 61502416), the Fundamental Re- search Funds for Central Universities (2017XZA217, 2016QNA5014), and 100 Talents Program of Zhejiang University.
Copyright © 2017 by Yingcai Wu. All rights reserved